
Overview
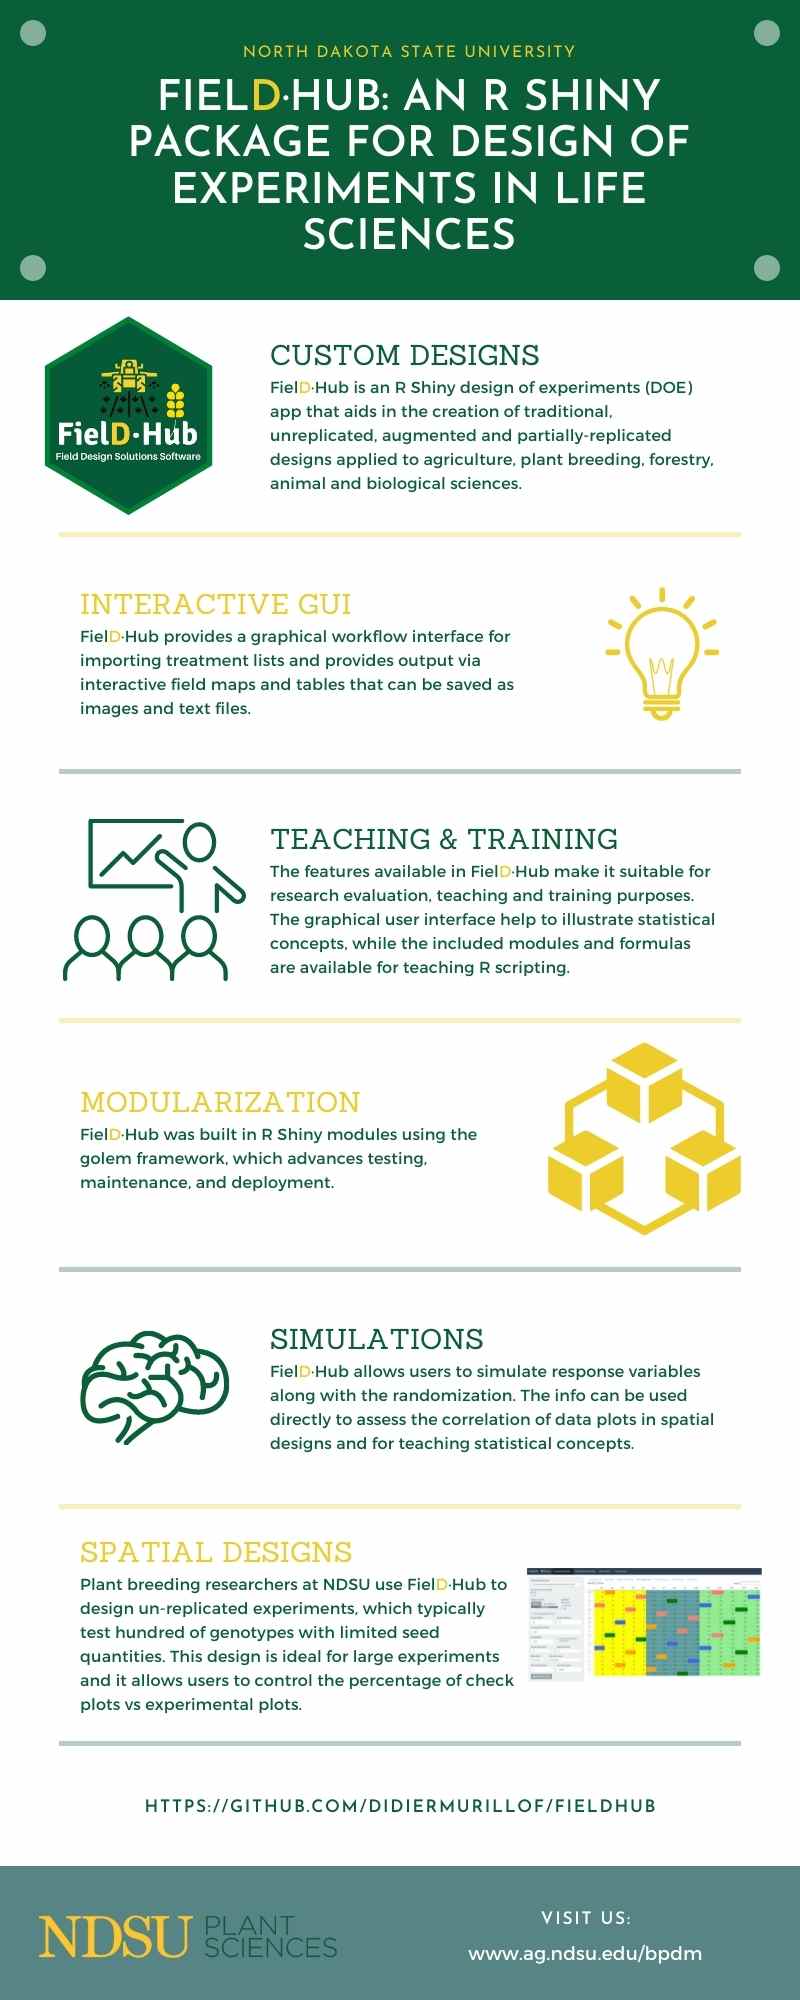
FielDHub is an R package/shiny design of experiments (DOE) app that aids in the creation of traditional, un-replicated, augmented and partially-replicated designs applied to agriculture, plant breeding, forestry, animal and biological sciences.
For more details and examples of all functions present in the FielDHub package. Please, go to https://didiermurillof.github.io/FielDHub/reference/index.html.
Version 1.6.0
The Shiny app and R package share one release version. This release retains the original input panels, adds native plot previews and consistent tab-local loading, and simplifies downloads. Required app dependencies install with the package; no golem configuration is needed. See the release notes for migration guidance and scientific corrections that may affect existing scripts or seeded results.
Usage
This is a basic example which shows you how to launch the app:
Diagonal Arrangement Example
A project needs to test 280 genotypes in a field containing 16 rows and 20 columns of plots. In this example, these 280 genotypes are divided among three different experiments. In addition, four checks are included in a systematic diagonal arrangement across experiments to fill 40 plots representing 12.5% of the total number of experimental plots. An option to include filler plots is also available for fields where the number of experimental plots does not equal the number of available field plots.
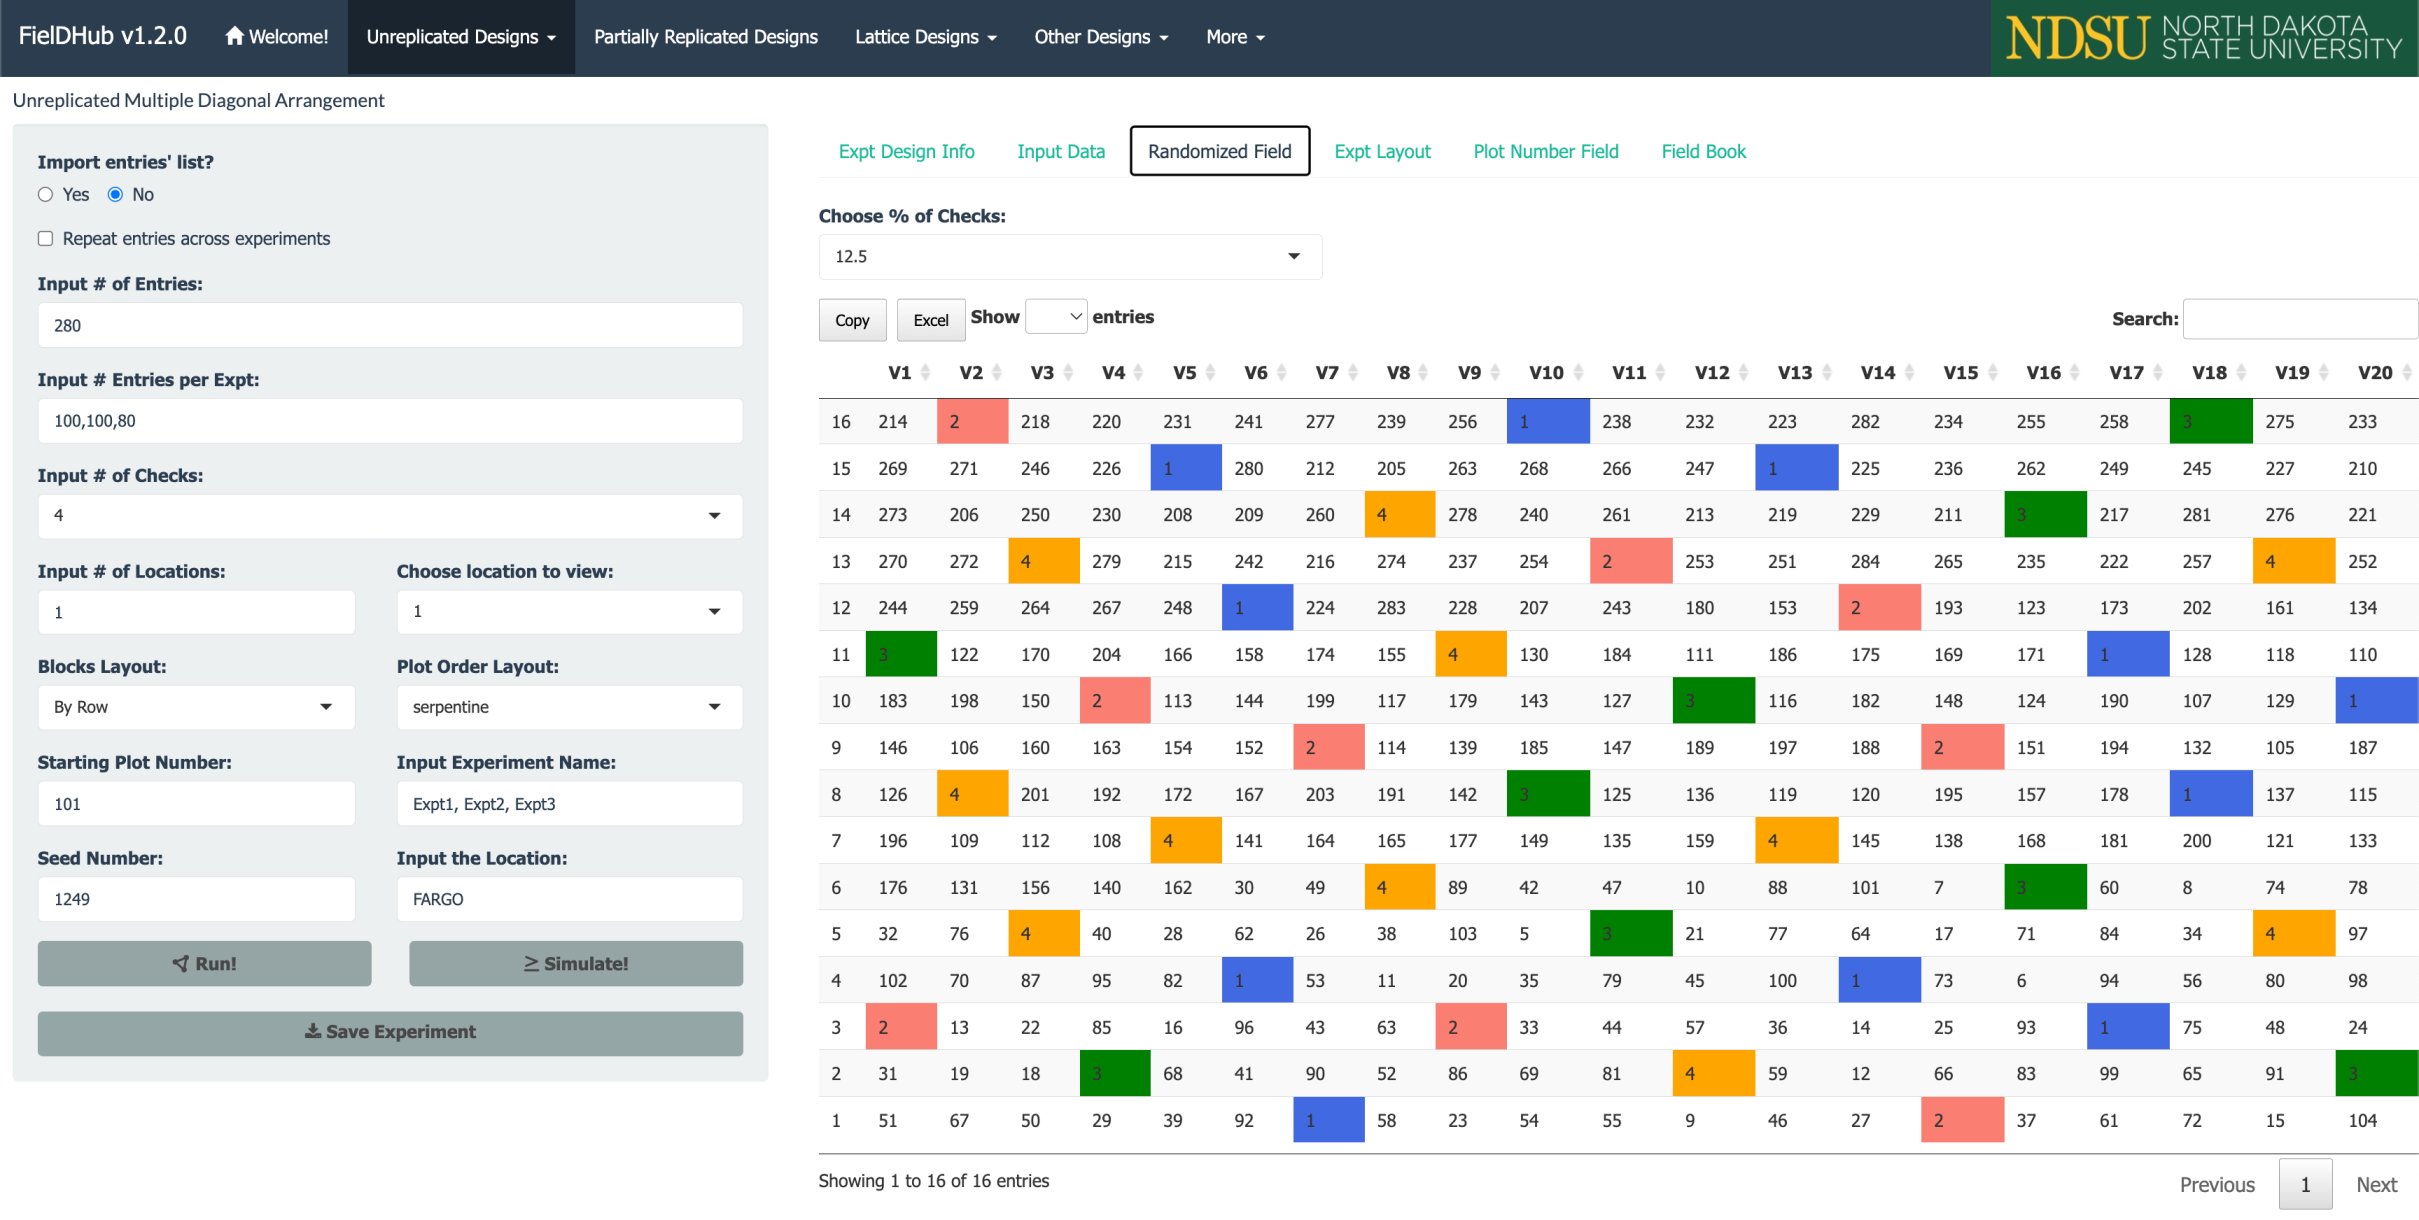
The figure above shows a map of an experiment randomized along with multiple experiments (three) and checks on diagonals. Distinctively colored check plots are replicated throughout the field in a systematic diagonal arrangement.
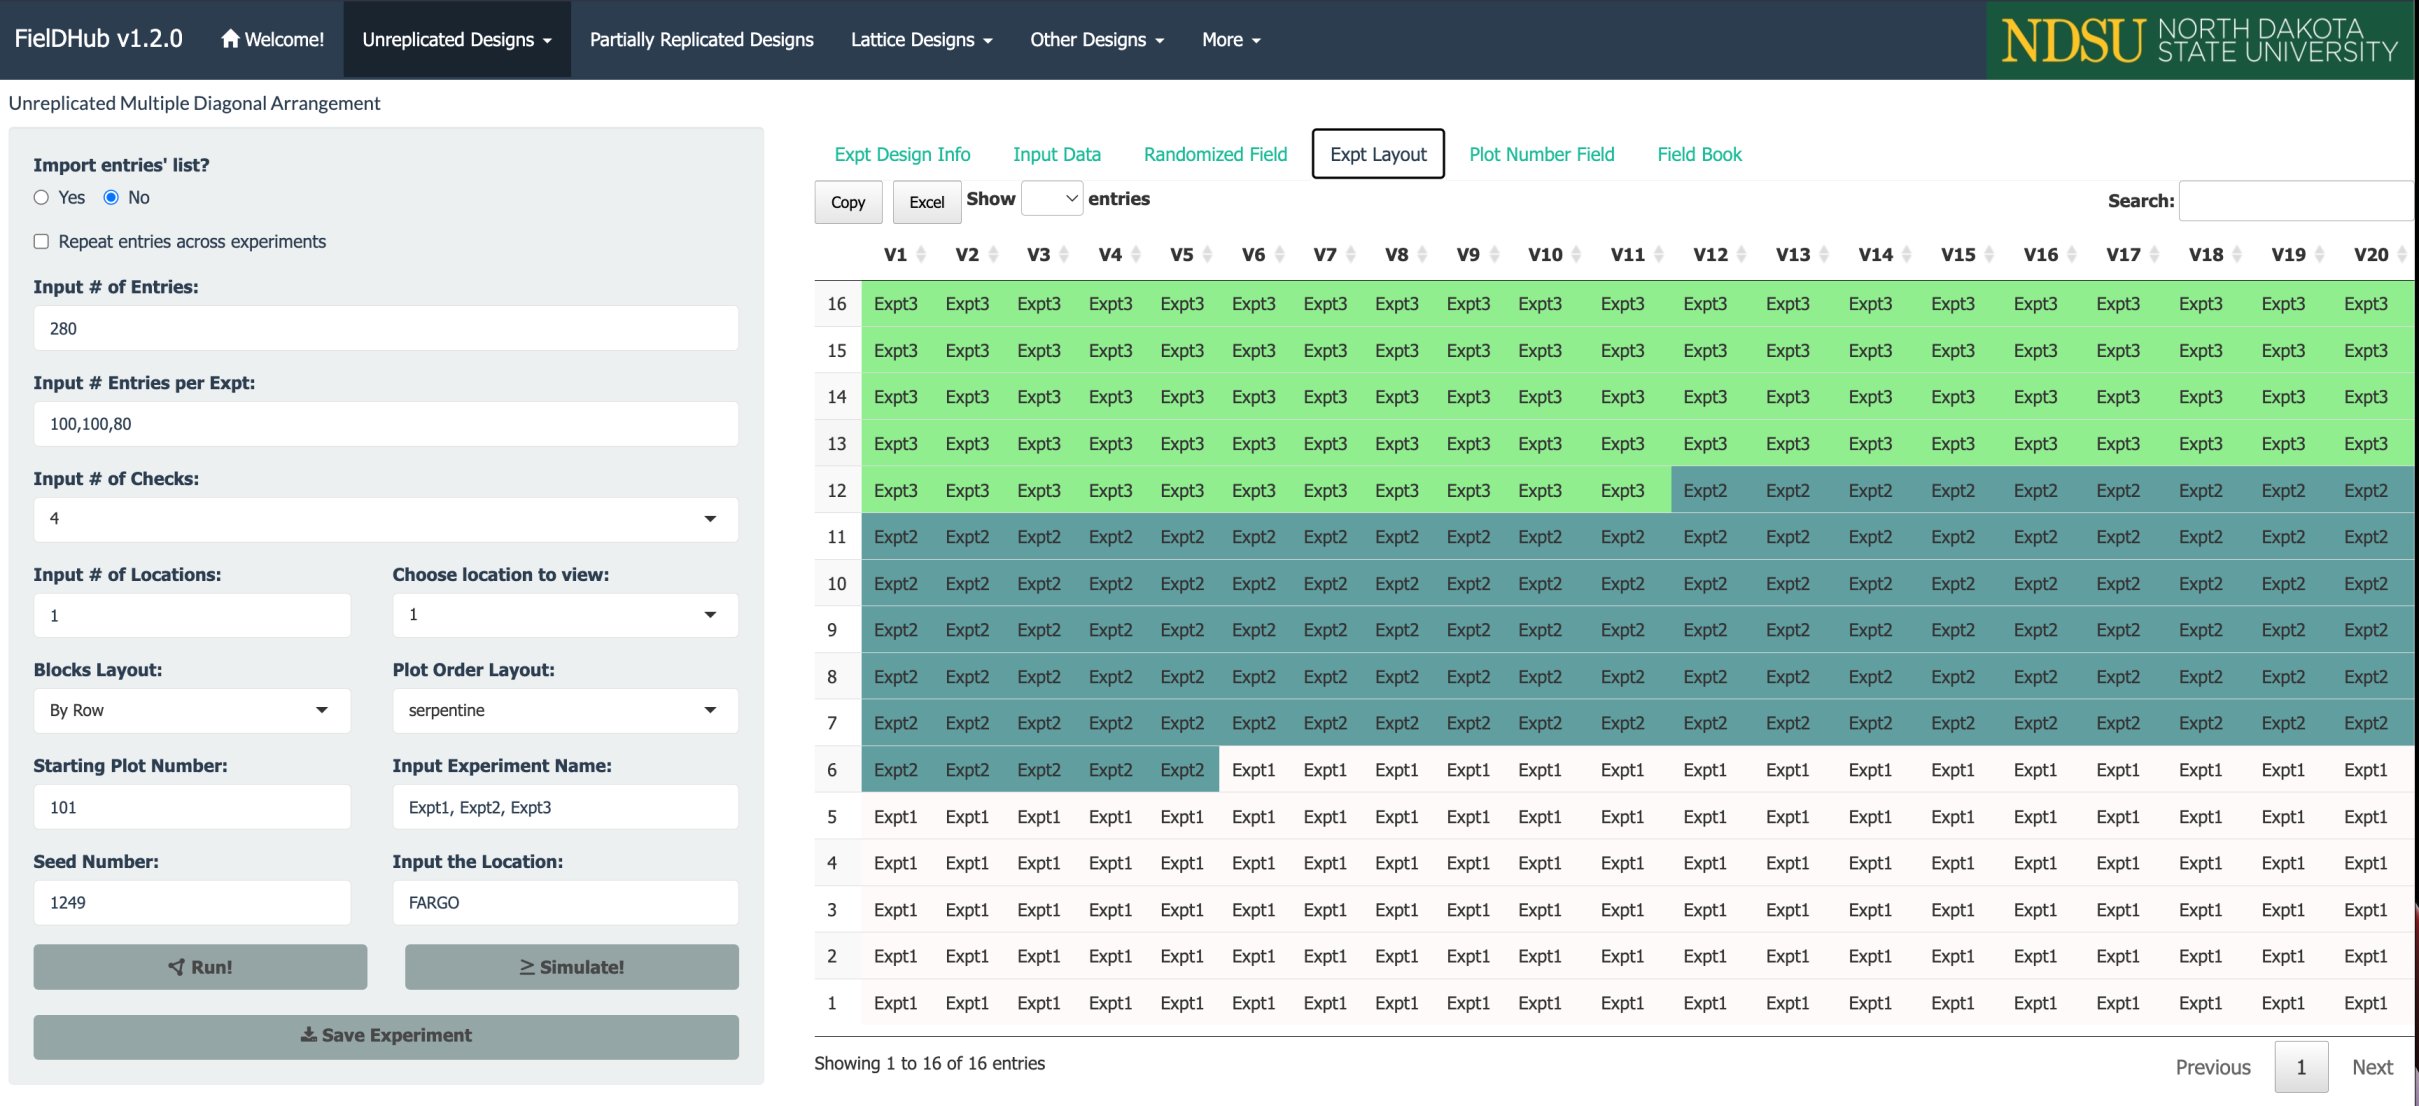
The figure above shows the layout for the three experiments in the field.
Using the FielDHub function diagonal_arrangement()
To illustrate using FielDHub to build experimental designs through R code, the design produced in the R Shiny interface described above can also be created using the function diagonal_arrangement() in the R script below. Note, that to obtain identical results, users must include the same random seed in the script as was used in the Shiny app. In this case, the random seed is 1249.
diagonal <- diagonal_arrangement(
  nrows = 16,
  ncols = 20,
  lines = 280,
  checks = 4,
  plotNumber = 101,
  splitBy = "row",
  seed = 1249,
  kindExpt = "DBUDC",
  blocks = c(100, 100, 80),
  exptName = c("Expt1", "Expt2", "Expt3")
)
Users can print the returned values from diagonal_arrangement() as follow,
print(diagonal)
Un-replicated Diagonal Arrangement Design

Information on the design parameters:
List of 11
 $ rows          : num 16
 $ columns       : num 20
 $ treatments    : num [1:3] 100 100 80
 $ checks        : int 4
 $ entry_checks  :List of 1
  ..$ : int [1:4] 1 2 3 4
 $ rep_checks    :List of 1
  ..$ : num [1:4] 10 10 10 10
 $ locations     : num 1
 $ planter       : chr "serpentine"
 $ percent_checks: chr "12.5%"
 $ fillers       : num 0
 $ seed          : num 1249

 10 First observations of the data frame with the diagonal_arrangement field book:
   ID  EXPT LOCATION YEAR PLOT ROW COLUMN CHECKS ENTRY TREATMENT
1   1 Expt1        1 2026  101   1      1      0    42    Gen-42
2   2 Expt1        1 2026  102   1      2      0    23    Gen-23
3   3 Expt1        1 2026  103   1      3      0    10    Gen-10
4   4 Expt1        1 2026  104   1      4      0    45    Gen-45
5   5 Expt1        1 2026  105   1      5      0    51    Gen-51
6   6 Expt1        1 2026  106   1      6      0    13    Gen-13
7   7 Expt1        1 2026  107   1      7      3     3   Check-3
8   8 Expt1        1 2026  108   1      8      0    43    Gen-43
9   9 Expt1        1 2026  109   1      9      0    84    Gen-84
10 10 Expt1        1 2026  110   1     10      0   102   Gen-102
First 12 rows of the fieldbook,
head(diagonal$fieldBook, 12)
   ID  EXPT LOCATION YEAR PLOT ROW COLUMN CHECKS ENTRY TREATMENT
1   1 Expt1        1 2026  101   1      1      0    42    Gen-42
2   2 Expt1        1 2026  102   1      2      0    23    Gen-23
3   3 Expt1        1 2026  103   1      3      0    10    Gen-10
4   4 Expt1        1 2026  104   1      4      0    45    Gen-45
5   5 Expt1        1 2026  105   1      5      0    51    Gen-51
6   6 Expt1        1 2026  106   1      6      0    13    Gen-13
7   7 Expt1        1 2026  107   1      7      3     3   Check-3
8   8 Expt1        1 2026  108   1      8      0    43    Gen-43
9   9 Expt1        1 2026  109   1      9      0    84    Gen-84
10 10 Expt1        1 2026  110   1     10      0   102   Gen-102
11 11 Expt1        1 2026  111   1     11      0    89    Gen-89
12 12 Expt1        1 2026  112   1     12      0    75    Gen-75
Users can plot the layout design from diagonal_arrangement() using the function plot() as follows,
plot(diagonal)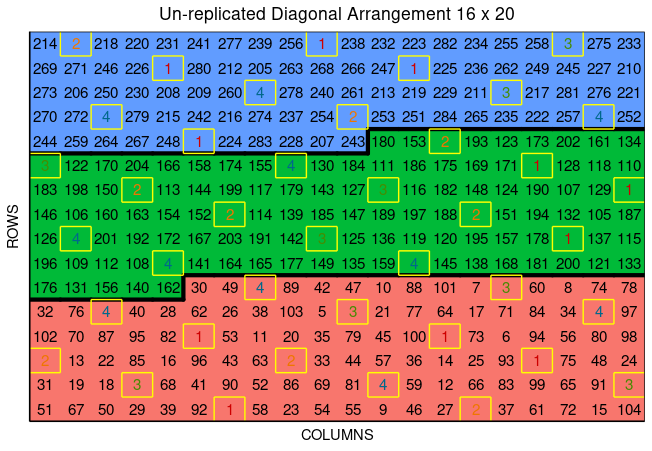
In the figure, salmon, green, and blue shade the blocks of unreplicated experiments, while distinctively colored check plots are replicated throughout the field in a systematic diagonal arrangement.
The main difference between using the FielDHub Shiny app and using the standalone function diagonal_arrangement() is that the standalone function will allocate filler only if it is necessary, while in Shiny App, users can customize the number of fillers if it is needed. In cases where users include fillers, either between or after experiments, the Shiny app is preferable for filling and visualizing all field plots.
To see more examples, go to https://didiermurillof.github.io/FielDHub/articles/diagonal_arrangement.html
Partially Replicated Design Example
Partially replicated designs are commonly employed in early generation field trials. This type of design is characterized by replication of a portion of the entries, with the remaining entries only appearing once in the experiment. As an example, considered a field trial with 288 plots containing 75 entries appearing two times each, and 138 entries only appearing once. This field trials is arranged in a field of 16 rows by 18 columns.
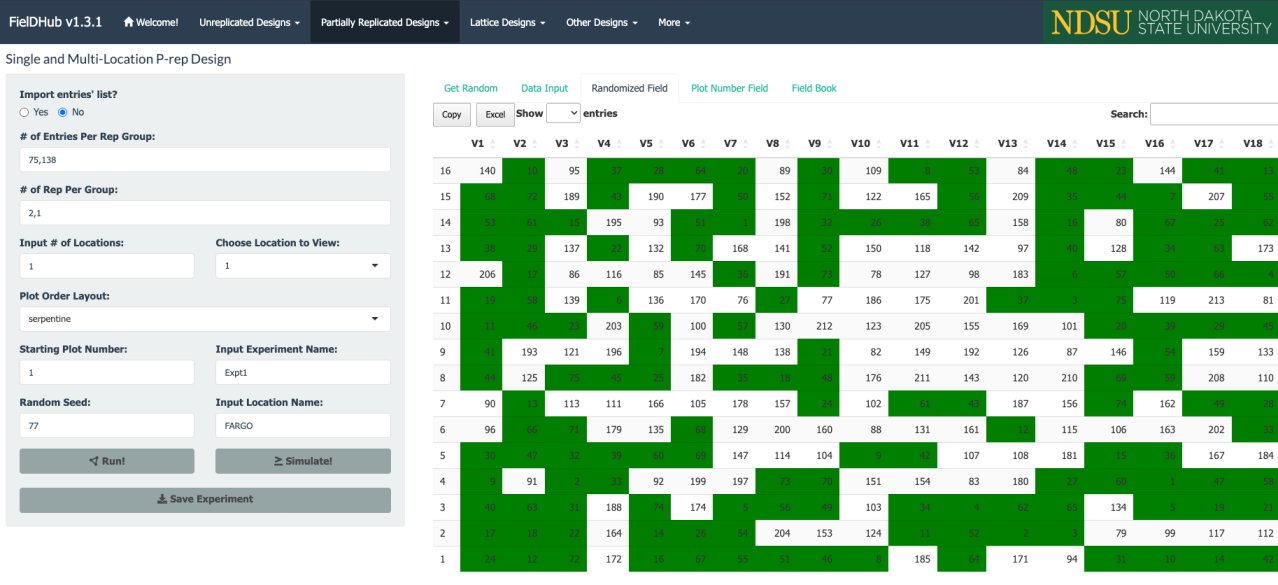
In the figure above, green plots contain replicated entries, and the other plots contain entries that only appear once.
Using the FielDHub function partially_replicated()
Instead of using the Shiny FielDHub app, users can use the standalone FielDHub function partially_replicated(). The partially replicated layout described above can be produced through scripting as follows. As noted in the previous example, to obtain identical results between the script and the Shiny app, users need to use the same random seed, which, in this case, is 77.
pREP <- partially_replicated(
  nrows = 16,
  ncols = 18,
  repGens = c(138,75),
  repUnits = c(1,2),
  planter = "serpentine",
  plotNumber = 1,
  exptName = "ExptA",
  locationNames = "FARGO",
  seed = 77
)
Users can print returned values from partially_replicated() as follows,
print(pREP)
Partially Replicated Design

Replications within location:
  LOCATION Replicated Unreplicated
1    FARGO         75          138

 Information on the design parameters:
List of 10
 $ rows              : num 16
 $ columns           : num 18
 $ min_distance      : num 5
 $ incidence_in_rows : num 1
 $ locations         : num 1
 $ planter           : chr "serpentine"
 $ experimental_plots: num 288
 $ field_capacity    : num 288
 $ fillers           : num 0
 $ seed              : num 77

 10 First observations of the data frame with the partially_replicated field book:
# A tibble: 10 × 11
      ID EXPT  LOCATION YEAR   PLOT   ROW COLUMN   REP CHECKS ENTRY TREATMENT
   <int> <chr> <chr>    <chr> <dbl> <int>  <int> <int>  <dbl> <dbl> <chr>
 1     1 ExptA FARGO    2026      1     1      1     1      0    69 G69
 2     2 ExptA FARGO    2026      2     1      2     1    158   158 G158
 3     3 ExptA FARGO    2026      3     1      3     1    157   157 G157
 4     4 ExptA FARGO    2026      4     1      4     1    201   201 G201
 5     5 ExptA FARGO    2026      5     1      5     1      0    79 G79
 6     6 ExptA FARGO    2026      6     1      6     1    213   213 G213
 7     7 ExptA FARGO    2026      7     1      7     1      0     1 G1
 8     8 ExptA FARGO    2026      8     1      8     1      0   103 G103
 9     9 ExptA FARGO    2026      9     1      9     1      0    37 G37
10    10 ExptA FARGO    2026     10     1     10     1      0    12 G12
First 12 rows of the fieldbook,
head(pREP$fieldBook, 12)
# A tibble: 12 × 11
      ID EXPT  LOCATION YEAR   PLOT   ROW COLUMN   REP CHECKS ENTRY TREATMENT
   <int> <chr> <chr>    <chr> <dbl> <int>  <int> <int>  <dbl> <dbl> <chr>
 1     1 ExptA FARGO    2026      1     1      1     1      0    69 G69
 2     2 ExptA FARGO    2026      2     1      2     1    158   158 G158
 3     3 ExptA FARGO    2026      3     1      3     1    157   157 G157
 4     4 ExptA FARGO    2026      4     1      4     1    201   201 G201
 5     5 ExptA FARGO    2026      5     1      5     1      0    79 G79
 6     6 ExptA FARGO    2026      6     1      6     1    213   213 G213
 7     7 ExptA FARGO    2026      7     1      7     1      0     1 G1
 8     8 ExptA FARGO    2026      8     1      8     1      0   103 G103
 9     9 ExptA FARGO    2026      9     1      9     1      0    37 G37
10    10 ExptA FARGO    2026     10     1     10     1      0    12 G12
11    11 ExptA FARGO    2026     11     1     11     1      0    99 G99
12    12 ExptA FARGO    2026     12     1     12     1      0    50 G50
Users can plot the layout design from partially_replicated() using the function plot() as follows,
plot(pREP)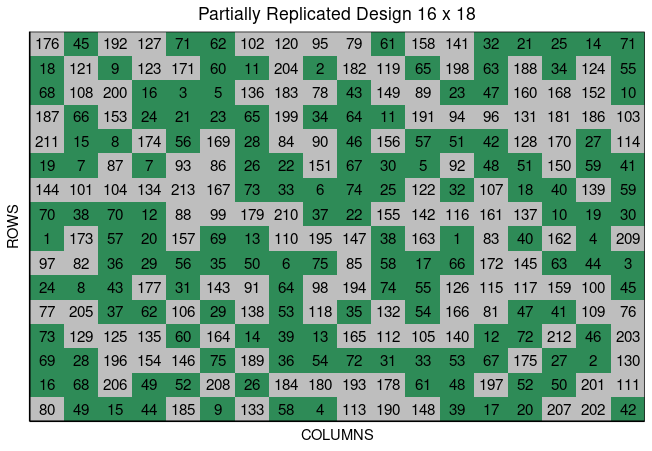
To see more examples, please go to https://didiermurillof.github.io/FielDHub/articles/partially_replicated.html