This vignette shows how to generate a randomized complete
block design using both the FielDHub Shiny App and the
scripting function RCBD() from the FielDHub
package.
1. Using the FielDHub Shiny App
To launch the app you need to run either
FielDHub::run_app()or
Once the app is running, go to Other Designs > Randomized Complete Block Designs (RCBD)
Then, follow the following steps where we show how to generate this kind of design by an example with 24 treatments and 4 reps. We will run this experiment in just one location.
Inputs
-
Import entries’ list? Choose whether to import a
list with entry numbers and names for genotypes or treatments.
If the selection is
No, that means the app is going to generate synthetic data for entries and names of the treatment/genotypes based on the user inputs.If the selection is
Yes, the entries list must fulfill a specific format and must be a.csvfile. The file must have the single columnTREATMENT, containing a list of unique names that identify each treatment/genotype. Duplicate values are not allowed, all entries must be unique. In the following, we show an example of the entries list format. This example has an entry list with 10 treatments.
| TREATMENT |
|---|
| TRT_A |
| TRT_B |
| TRT_C |
| TRT_D |
| TRT_E |
| TRT_F |
| TRT_G |
| TRT_H |
| TRT_I |
| TRT_J |
Input the number of treatments in the Input # of Treatments box. Set it to
24.Select the number of replications of these treatments with the Input # of Full Reps box. The number of treatments and the number of full reps set the dimensions of the field. Set it to
4.Enter the number of locations in Input # of Locations. We will run this experiment over a single location, so set it to
1.Select
serpentineorcartesianin the Plot Order Layout. For this example we will use the defaultserpentinelayout.Enter the starting plot number in the Starting Plot Number box. If the experiment has multiple locations, you must enter a comma separated list of numbers the length of the number of locations for the input to be valid. For this case, set it to
101.Enter a name for the location of the experiment in the Input Location box. If there are multiple locations, each name must be in a comma separated list. Set it to
"FARGO".To ensure that randomizations are consistent across sessions, we can set a random seed in the box labeled random seed. In this example, we will set it to
1237.Once we have entered the information for our experiment on the left side panel, click the Run! button to run the design.
Outputs
After you run a randomized complete block design in FielDHub, there are several ways to display the information contained in the field book.
Field Layout
When you first click the run button on a randomized complete block
design, FielDHub displays the Field Layout tab, which shows the entries
and their arrangement in the field. In the box below the display, you
can change the layout of the field or change the location displayed. You
can also display a heatmap over the field by changing Type of
Plot to Heatmap. To view a heatmap, you must first
simulate an experiment over the described field with the
Simulate! button. A pop-up window will appear where you
can enter what variable you want to simulate along with minimum and
maximum values.
Field Book
The Field Book displays all the information on the experimental design in a table format. It contains the specific plot number and the row and column address of each entry, as well as the corresponding treatment on that plot. This table is searchable, and we can filter the data in relevant columns. If we have simulated data for a heatmap, an additional column for that variable appears in the field book.
2. Using the FielDHub function:
RCBD()
You can run the same design with a function in the FielDHub package,
RCBD().
First, you need to load the FielDHub package typing,
Then, you can enter the information describing the above design like this:
rcbd <- RCBD(
  t = 24,
  reps = 4,
  l = 1,
  plotNumber = 101,
  locationNames = "FARGO",
  seed = 1237
)
Details on the inputs entered in RCBD() above
The description for the inputs that we used to generate the design,
-
t = 24is the number of treatments. -
reps = 4is the number of replications for each treatment. -
l = 1is the number of locations. -
plotNumber = 101is the starting plot number. -
locationNames = "FARGO"is an optional name for each location. -
seed = 1234is the random seed to replicate identical randomizations.
Print rcbd object
print(rcbd)Randomized Complete Block Design (RCBD):
Information on the design parameters:
List of 7
$ blocks : num 4
$ number.of.treatments: num 24
$ treatments : chr [1:24] "T1" "T2" "T3" "T4" ...
$ locations : num 1
$ plotNumber : num [1:4] 101 201 301 401
$ locationNames : chr "FARGO"
$ seed : num 1237
10 First observations of the data frame with the RCBD field book:
ID LOCATION PLOT REP TREATMENT
1 1 FARGO 101 1 T6
2 2 FARGO 102 1 T1
3 3 FARGO 103 1 T21
4 4 FARGO 104 1 T7
5 5 FARGO 105 1 T14
6 6 FARGO 106 1 T17
7 7 FARGO 107 1 T12
8 8 FARGO 108 1 T11
9 9 FARGO 109 1 T3
10 10 FARGO 110 1 T5Access to RCBD object
The function RCBD returns a list consisting of all the
information displayed in the output tabs in the FielDHub app: design
information, plot layout, plot numbering, entries list, and field book.
These are accessible by the $ operator,
i.e. rcbd$layoutRandom or rcbd$fieldBook.
rcbd$fieldBook is a list containing information about
every plot in the field, with information about the location of the plot
and the treatment in each plot. As seen in the output below, the field
book has columns for ID, LOCATION,
PLOT, REP, IBLOCK,
UNIT, ENTRY, and TREATMENT.
field_book <- rcbd$fieldBook
head(rcbd$fieldBook, 10)
ID LOCATION PLOT REP TREATMENT
1 1 FARGO 101 1 T6
2 2 FARGO 102 1 T1
3 3 FARGO 103 1 T21
4 4 FARGO 104 1 T7
5 5 FARGO 105 1 T14
6 6 FARGO 106 1 T17
7 7 FARGO 107 1 T12
8 8 FARGO 108 1 T11
9 9 FARGO 109 1 T3
10 10 FARGO 110 1 T5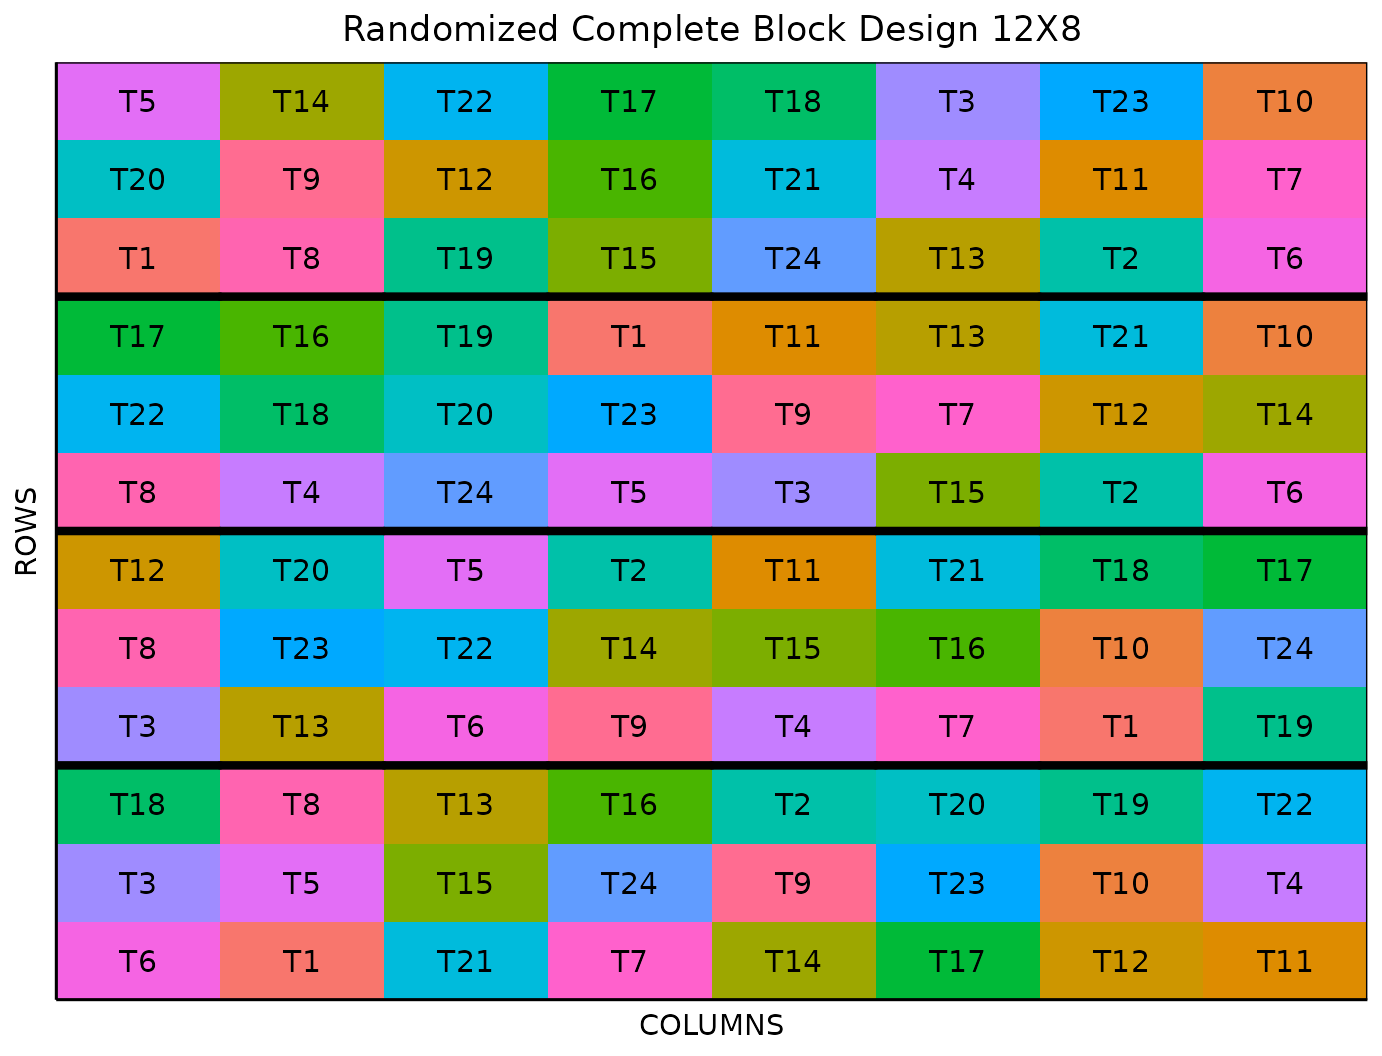
RCBD with repeated checks
In a classical RCBD, the residual is the treatment-by-block
interaction, estimated by comparing each treatment’s performance across
blocks. Repeating one or more checks inside every block gives an
additional, within-block estimate of error and a form of local control
that a design with each treatment appearing only once per block cannot
provide. RCBD() supports this through three extra
arguments: checks (a count or a vector of check labels),
rep_checks (how many times each check repeats per block),
and spread_checks (whether the repeated copies are spread
across the block or placed with no restriction).
rcbd_checks <- RCBD(
  t = 18,
  reps = 3,
  checks = c("CK1", "CK2"),
  rep_checks = c(2, 2),
  plotNumber = 101,
  seed = 1234,
  locationNames = "FARGO"
)
Here, t = 18 test entries are automatically labeled
T1…T18, and the two checks "CK1"
and "CK2" are each repeated twice per block
(rep_checks = c(2, 2)), so every block has
18 + 2 + 2 = 22 plots.
head(rcbd_checks$fieldBook, 10) ID LOCATION PLOT REP ENTRY CHECKS TREATMENT
1 1 FARGO 101 1 7 0 T5
2 2 FARGO 102 1 8 0 T6
3 3 FARGO 103 1 18 0 T16
4 4 FARGO 104 1 6 0 T4
5 5 FARGO 105 1 2 2 CK2
6 6 FARGO 106 1 4 0 T2
7 7 FARGO 107 1 9 0 T7
8 8 FARGO 108 1 19 0 T17
9 9 FARGO 109 1 12 0 T10
10 10 FARGO 110 1 1 1 CK1When checks is supplied, the field book gains an
ENTRY column (a stable entry id for every check and test
entry) and a CHECKS column (0 for test
entries, and a positive check index for each check) alongside the usual
ID, LOCATION, PLOT,
REP and TREATMENT columns.
plot(rcbd_checks)
With spread_checks = TRUE (the default), the repeated
copies of each check are placed one per contiguous stratum of the block.
This greatly reduces the odds of two copies landing side by side
compared to placing the whole block with no restriction
(spread_checks = FALSE) — measured across many simulated
blocks, about 21.6% of blocks had two copies of a check adjacent with
spreading on, versus about 62.1% with spreading off. Spreading is not a
guarantee, though: because strata are contiguous ranges of plots, two
copies can still end up next to each other right at a stratum boundary.
How often that happens depends on check density — roughly 1.6% of blocks
for this vignette’s own example, rising to roughly 22.8% at 33% check
density and roughly 69% at 50% check density. In short, spreading places
one copy per stratum and substantially lowers, but does not eliminate,
the chance of adjacent copies.